Ramin Nabati
Sunday, May 10, 2020
Radar-Camera Sensor Fusion and Depth Estimation
Introduction
In this project, we designed and implemented a radar-camera fusion algorithm for joint object detection and distance estimation in autonomous driving applications. The proposed method is designed as a two-stage object detection network that fuses radar point clouds and learned image features to generate accurate object proposals. For every object proposal, a depth value is also calculated to estimate the object’s distance from the vehicle. These proposals are then fed into the second stage of the detection network for object classification. We evaluate our network on the nuScenes dataset, which provides synchronized data from multiple radar and camera sensors on a vehicle. Our experiments show that the proposed method outperforms other radar-camera fusion methods in the object detection task and is capable of accurately estimating distance for all detected objects.
Approach
Network architecture
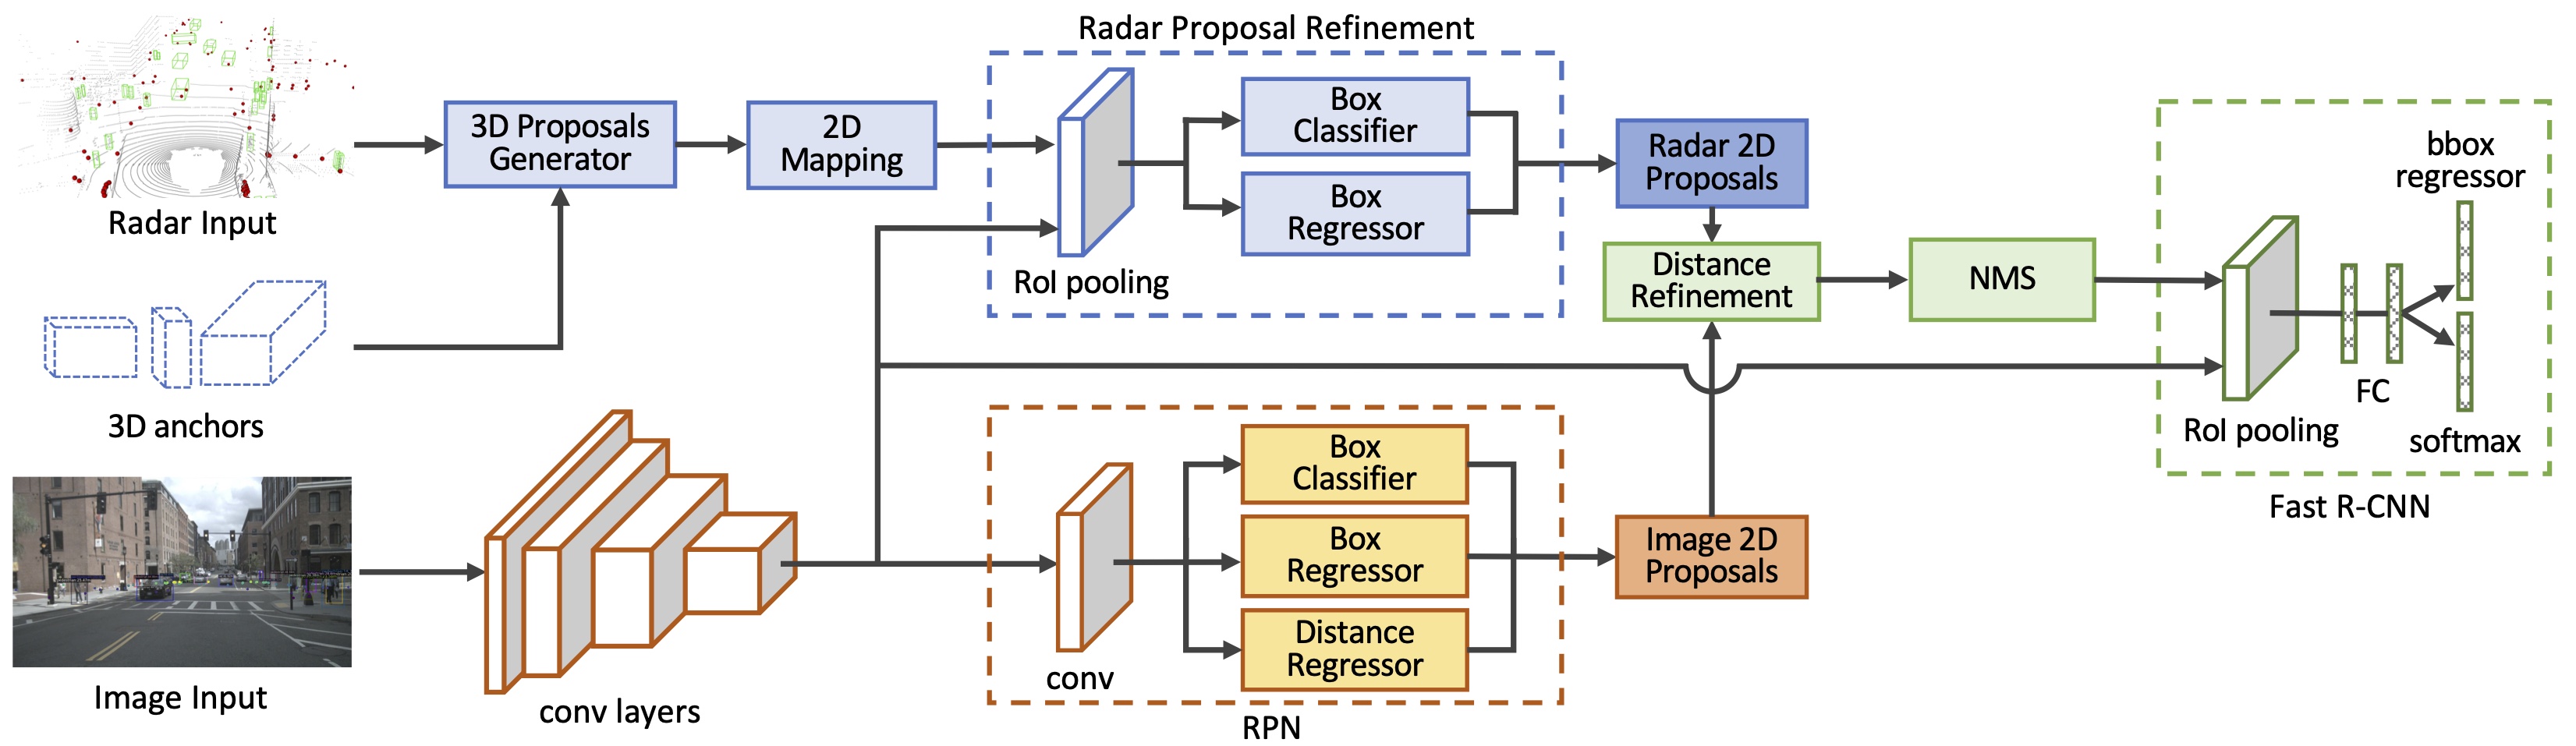
Our proposed sensor fusion network is shown in the figure above. The network takes radar point clouds and RGB images as input and generates accurate object proposals for a two-stage object detection framework. We take a middle-fusion approach for fusing the radar and image data, where outputs of each sensor are processed independently first, and are merged at a later stage for more processing. More specifically, we first use the radar detections to generate 3D object proposals, then map the proposals to the image and use the image features extracted by a backbone network to improve their localization. These proposals are then merged with image-based proposals generated in a RPN, and are fed to the second stage for classification. All generated proposals are associated with an estimated depth, calculated either directly from the radar detections, or via a distance regressor layer in the RPN network.
Proposal Generation
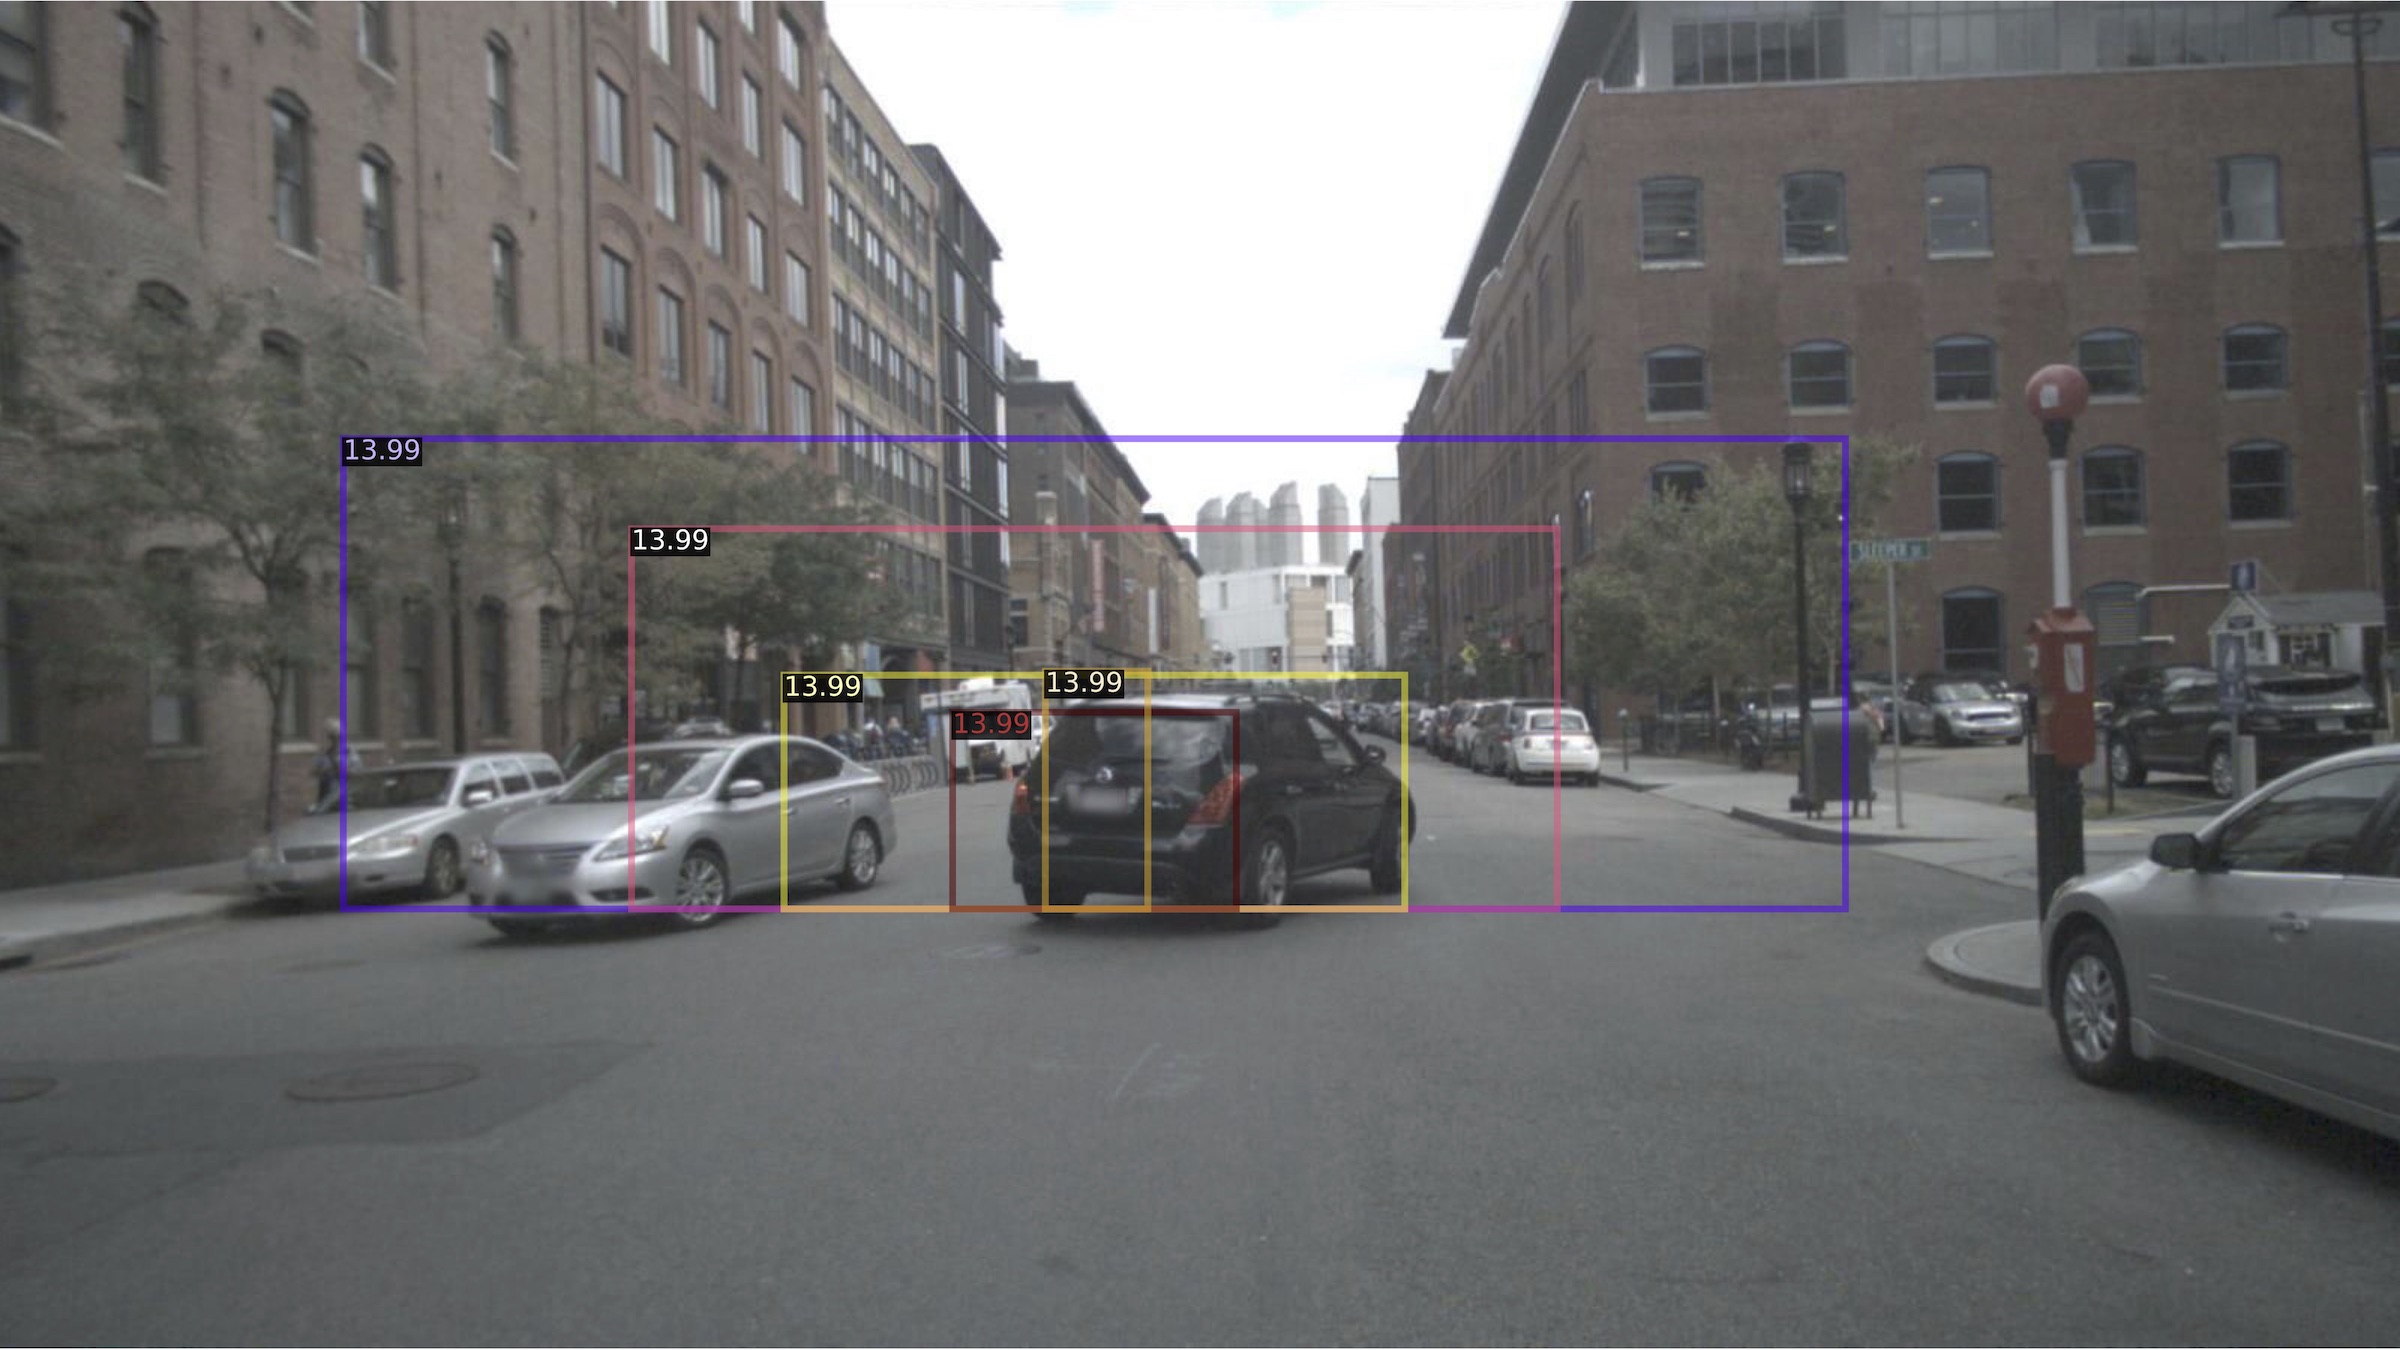
We treat every radar point as a stand-alone detection and generate 3D object proposals for them directly without any feature extraction. These proposals are generated using predefined 3D anchors for every object class in the dataset. Each 3D anchor is parameterized as $(x, y, z, w, l, h, r)$, where $(x, y, z)$ is the center, $(w, l, h)$ is the size, and $r$ is the orientation of the box in vehicle’s coordinate system. The anchor size, $(w, l, h)$, is fixed for each object category, and is set to the average size of the objects in each category in the training dataset. For every radar point, we generate $2n$ boxes from the 3D anchors, where $n$ is the number of object classes in the dataset, each having two different orientations at $0 $ and $90$ degrees. The 3D anchors for a radar detection is shown in the figure below:

3D anchors for one radar detection point
In the next step, all 3D anchors are mapped to the image plane and converted to equivalent 2D bounding boxes by finding the smallest enclosing box for each mapped anchor. Since every 3D proposal is generated from a radar detection, it has an accurate distance associated with it. This distance is used as the proposed distance for the generated 2D bounding box. This is illustrated in the figure below:
3D anchors for one radar detection point
All generated 2D proposals are fed into the Radar Proposal Refinement (RPR) subnetwork. This is where the information obtained from the radars (radar proposals) is fused with the information obtained from the camera (image features). RPR uses the features extracted from the image by the backbone network to adjust the size and location of the radar proposals on the image. As radar detections are not always centered on the corresponding objects on the image, the generated 3D anchors and corresponding 2D proposals might be offset as well. The box regressor layer in the RPR uses the image features inside each radar proposal to regress offset values for the proposal corner points. The RPR also contains a box classification layer, which estimates an objectness score for every radar proposal. The objectness score is used to eliminate proposals that are generated by radar detections coming from background objects, such as buildings and light poles. Figures below show the resulting 2D radar proposals before and after the refinement step.
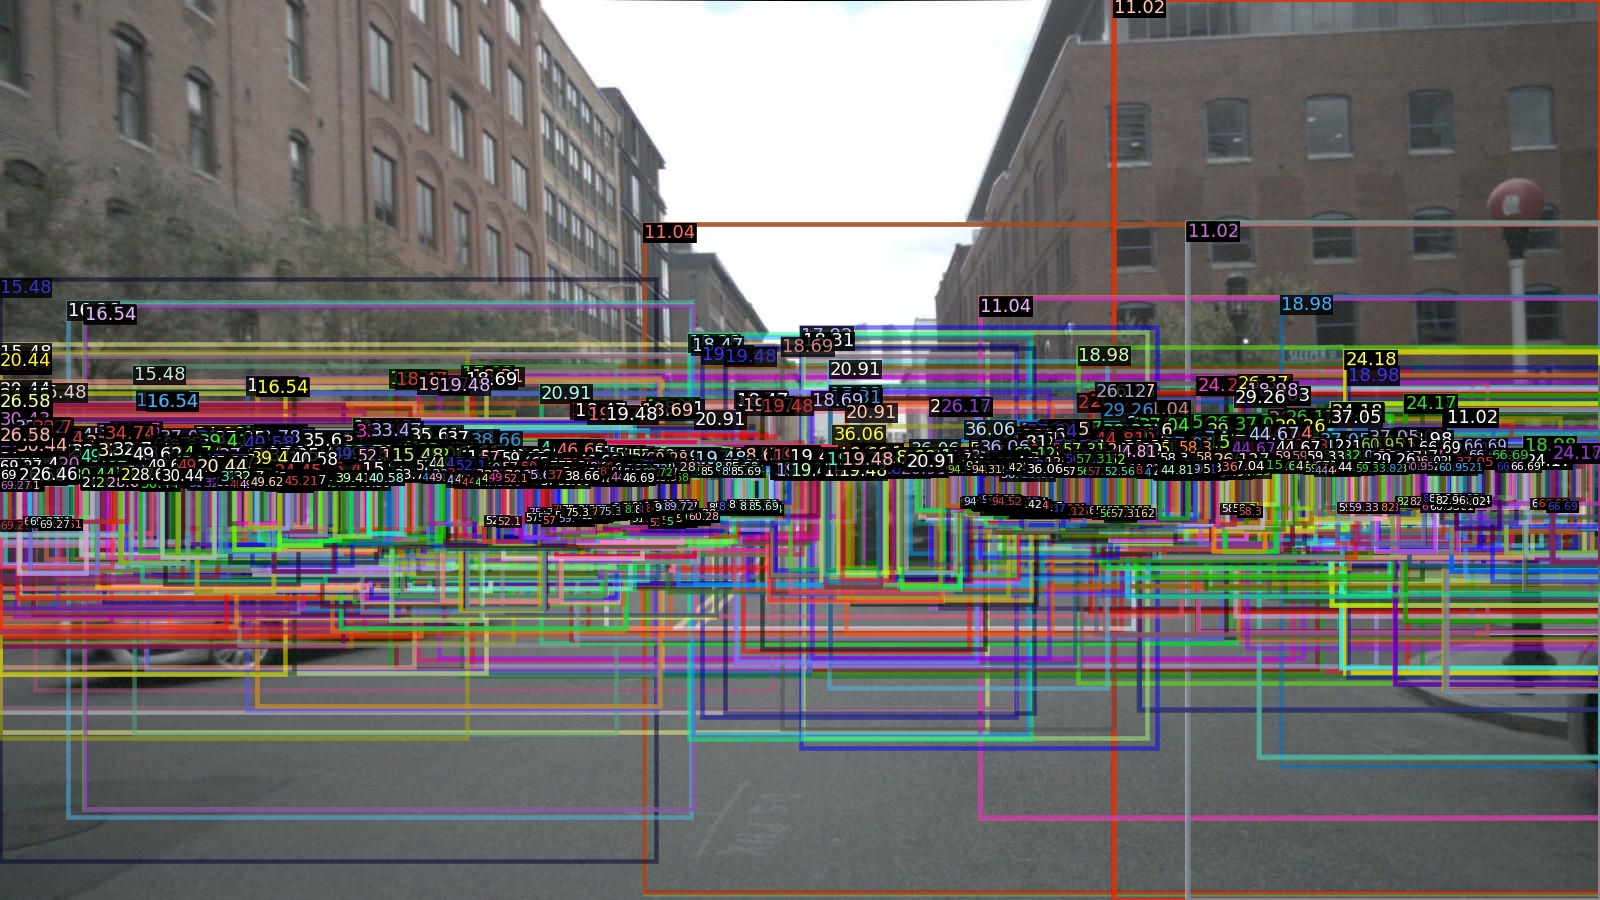
Radar proposals before refinement
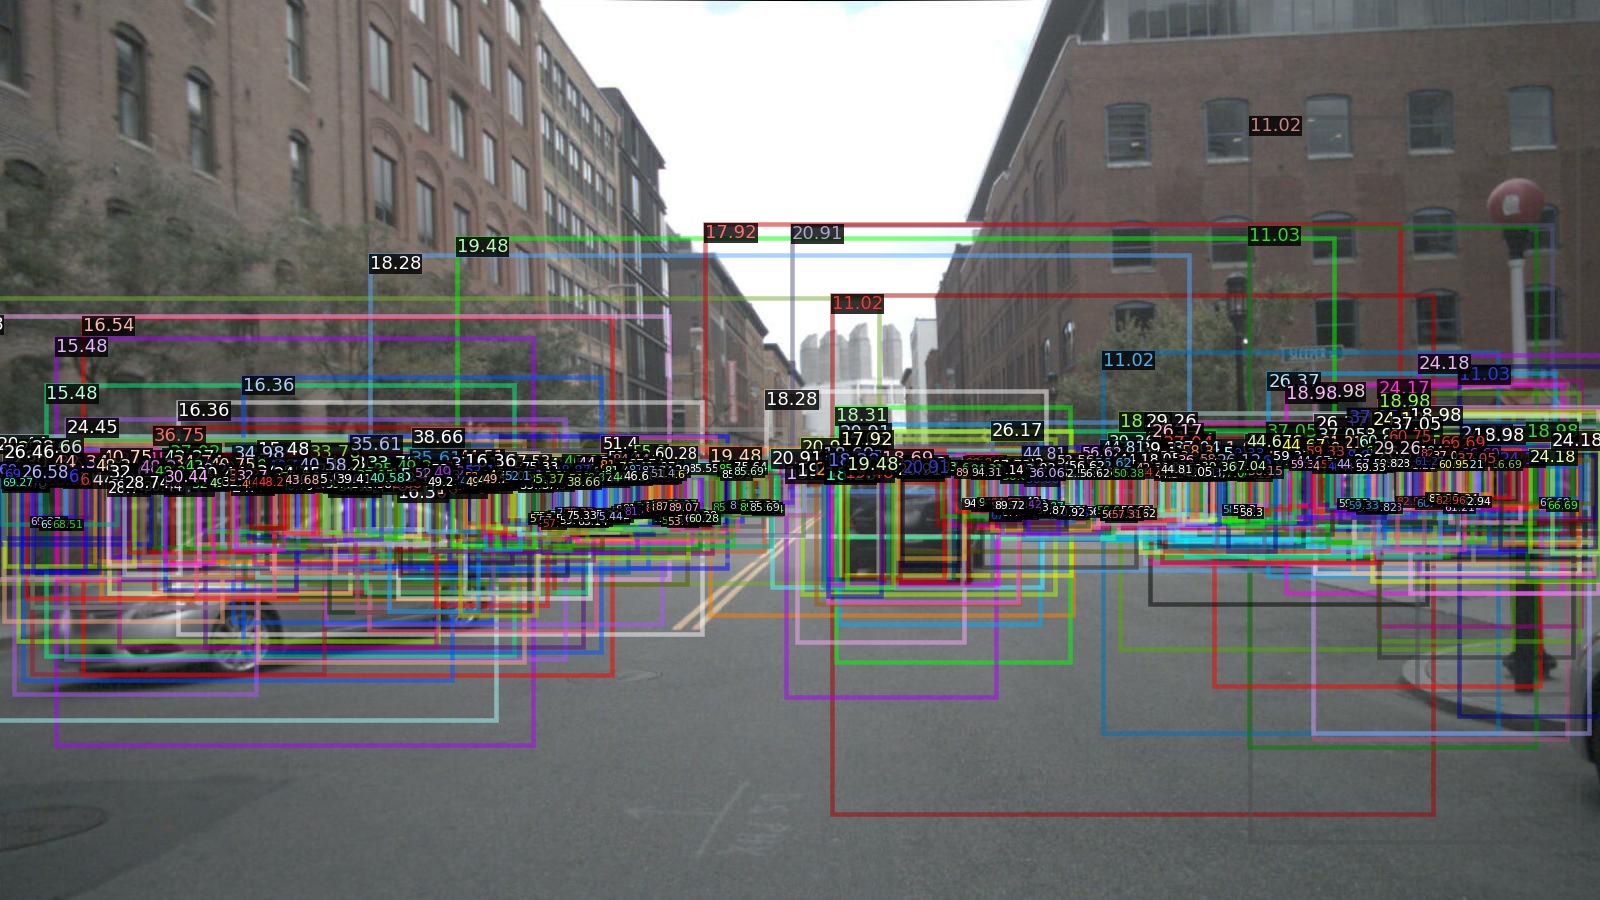
Radar proposals after refinement
The Radar proposals are then merged with image-based proposals obtained from a Region Proposal Network (RPN). Before using these proposals in the next stage, redundant proposals are removed by applying NonMaximum Suppression (NMS). The NMS would normally remove overlapping proposals without discriminating based on the bounding box’s origin, but we note that radar-based proposals have more reliable distance information than the image-based proposals. This is because image-based distances are estimated only from 2D image feature maps with no depth information. To make sure the radar-based distances are not unnecessarily discarded in the NMS process, we first calculate the Intersection over Union (IoU) between radar and image proposals. Next we use an IoU threshold to find the matching proposals, and overwrite the imagebased distances by their radar-based counterparts for these matching proposals.
Detection Network
The inputs to the second stage detection network are the feature map from the image and object proposals. The structure of this network is similar to Fast R-CNN. The feature map is cropped for every object proposals and is fed into the RoI pooling layer to obtain feature vectors of the same size for all proposals. These feature vectors are further processed by a set of fully connected layers and are passed to the softmax and bounding box regression layers. The output is the category classification and bounding box regression for each proposal, in addition to the distance associated to every detected object. Similar to the RPN network, we use a cross entropy loss for object classification and a Smooth L1 loss for the box regression layer.
Results
The performance of our method is shown in the table below. This table shows the overall Average Precision (AP) and Average Recall (AR) for the detection task, and Mean Absolute Error for the distance estimation task. We use the Faster RCNN network as our image-based detection baseline, and compare our results with RRPN.
| Method | AP | AP50 | AP75 | AR | MAE |
|---|---|---|---|---|---|
| Faster R-CNN | 34.95 | 58.23 | 36.89 | 40.21 | - |
| RRPN | 35.45 | 59.00 | 37.00 | 42.10 | - |
| Ours | 35.60 | 60.53 | 37.38 | 42.10 | 2.65 |
The per-class performance is show in the table below:
| Method | Car | Truck | Person | Bus | Bicycle | Motorcycle |
|---|---|---|---|---|---|---|
| Faster R-CNN | 51.46 | 33.26 | 27.06 | 47.73 | 24.27 | 25.93 |
| RRPN | 41.80 | 44.70 | 17.10 | 57.20 | 21.40 | 30.50 |
| Ours | 52.31 | 34.45 | 27.59 | 48.30 | 25.00 | 25.97 |
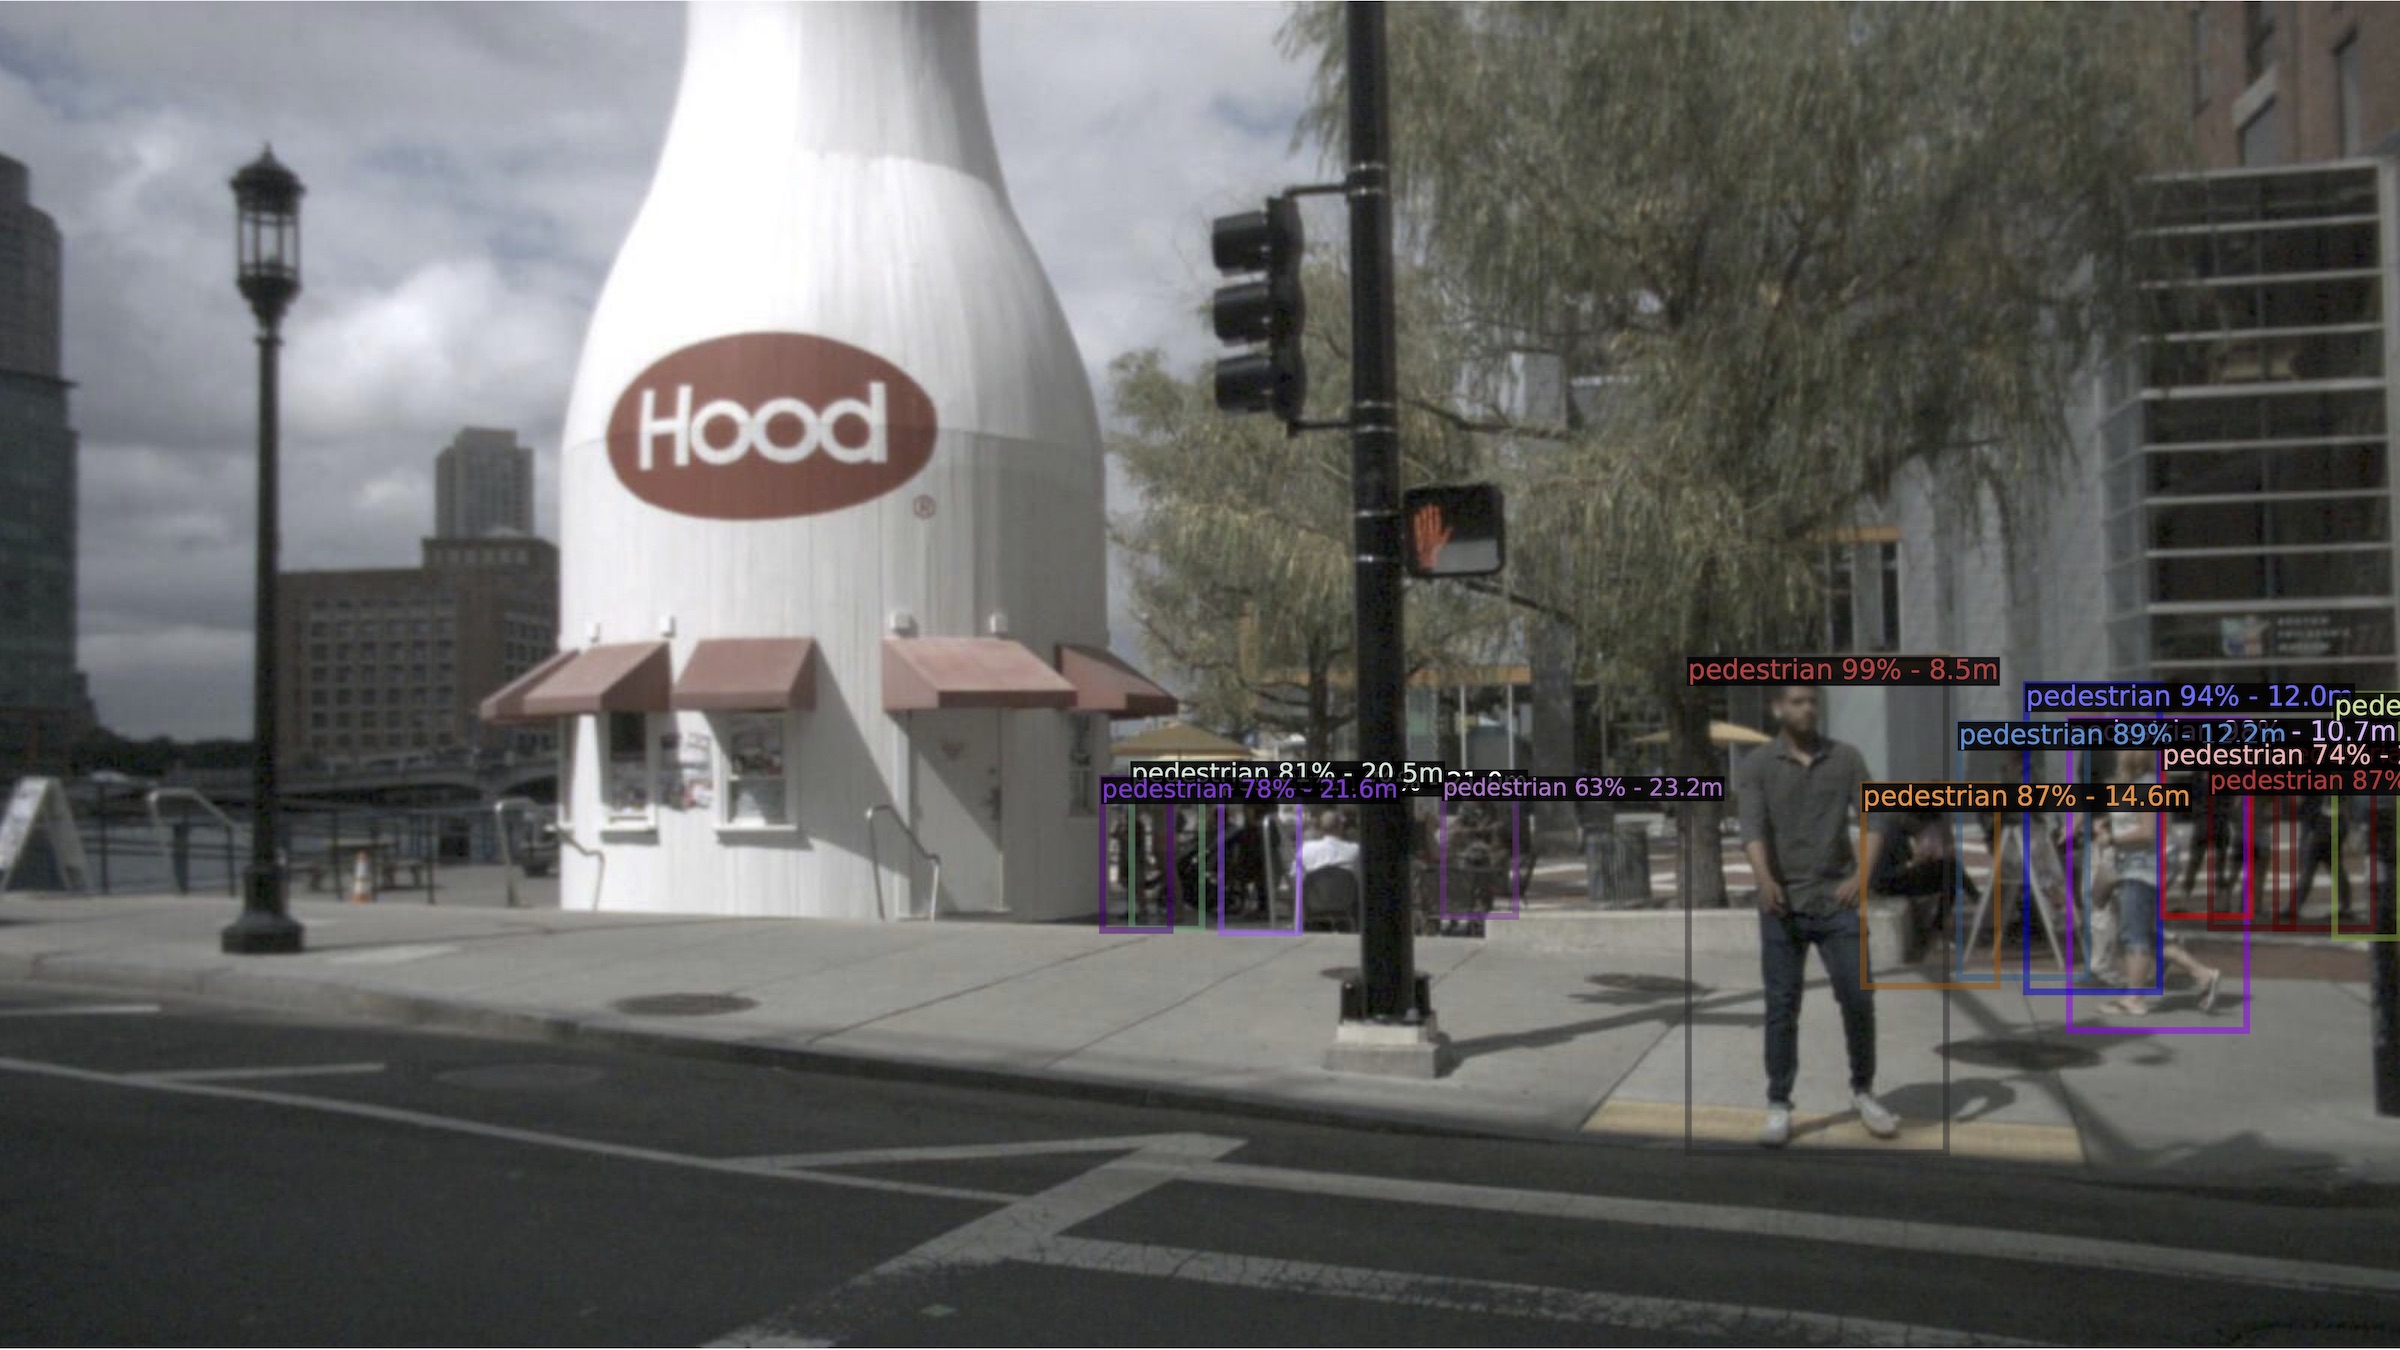
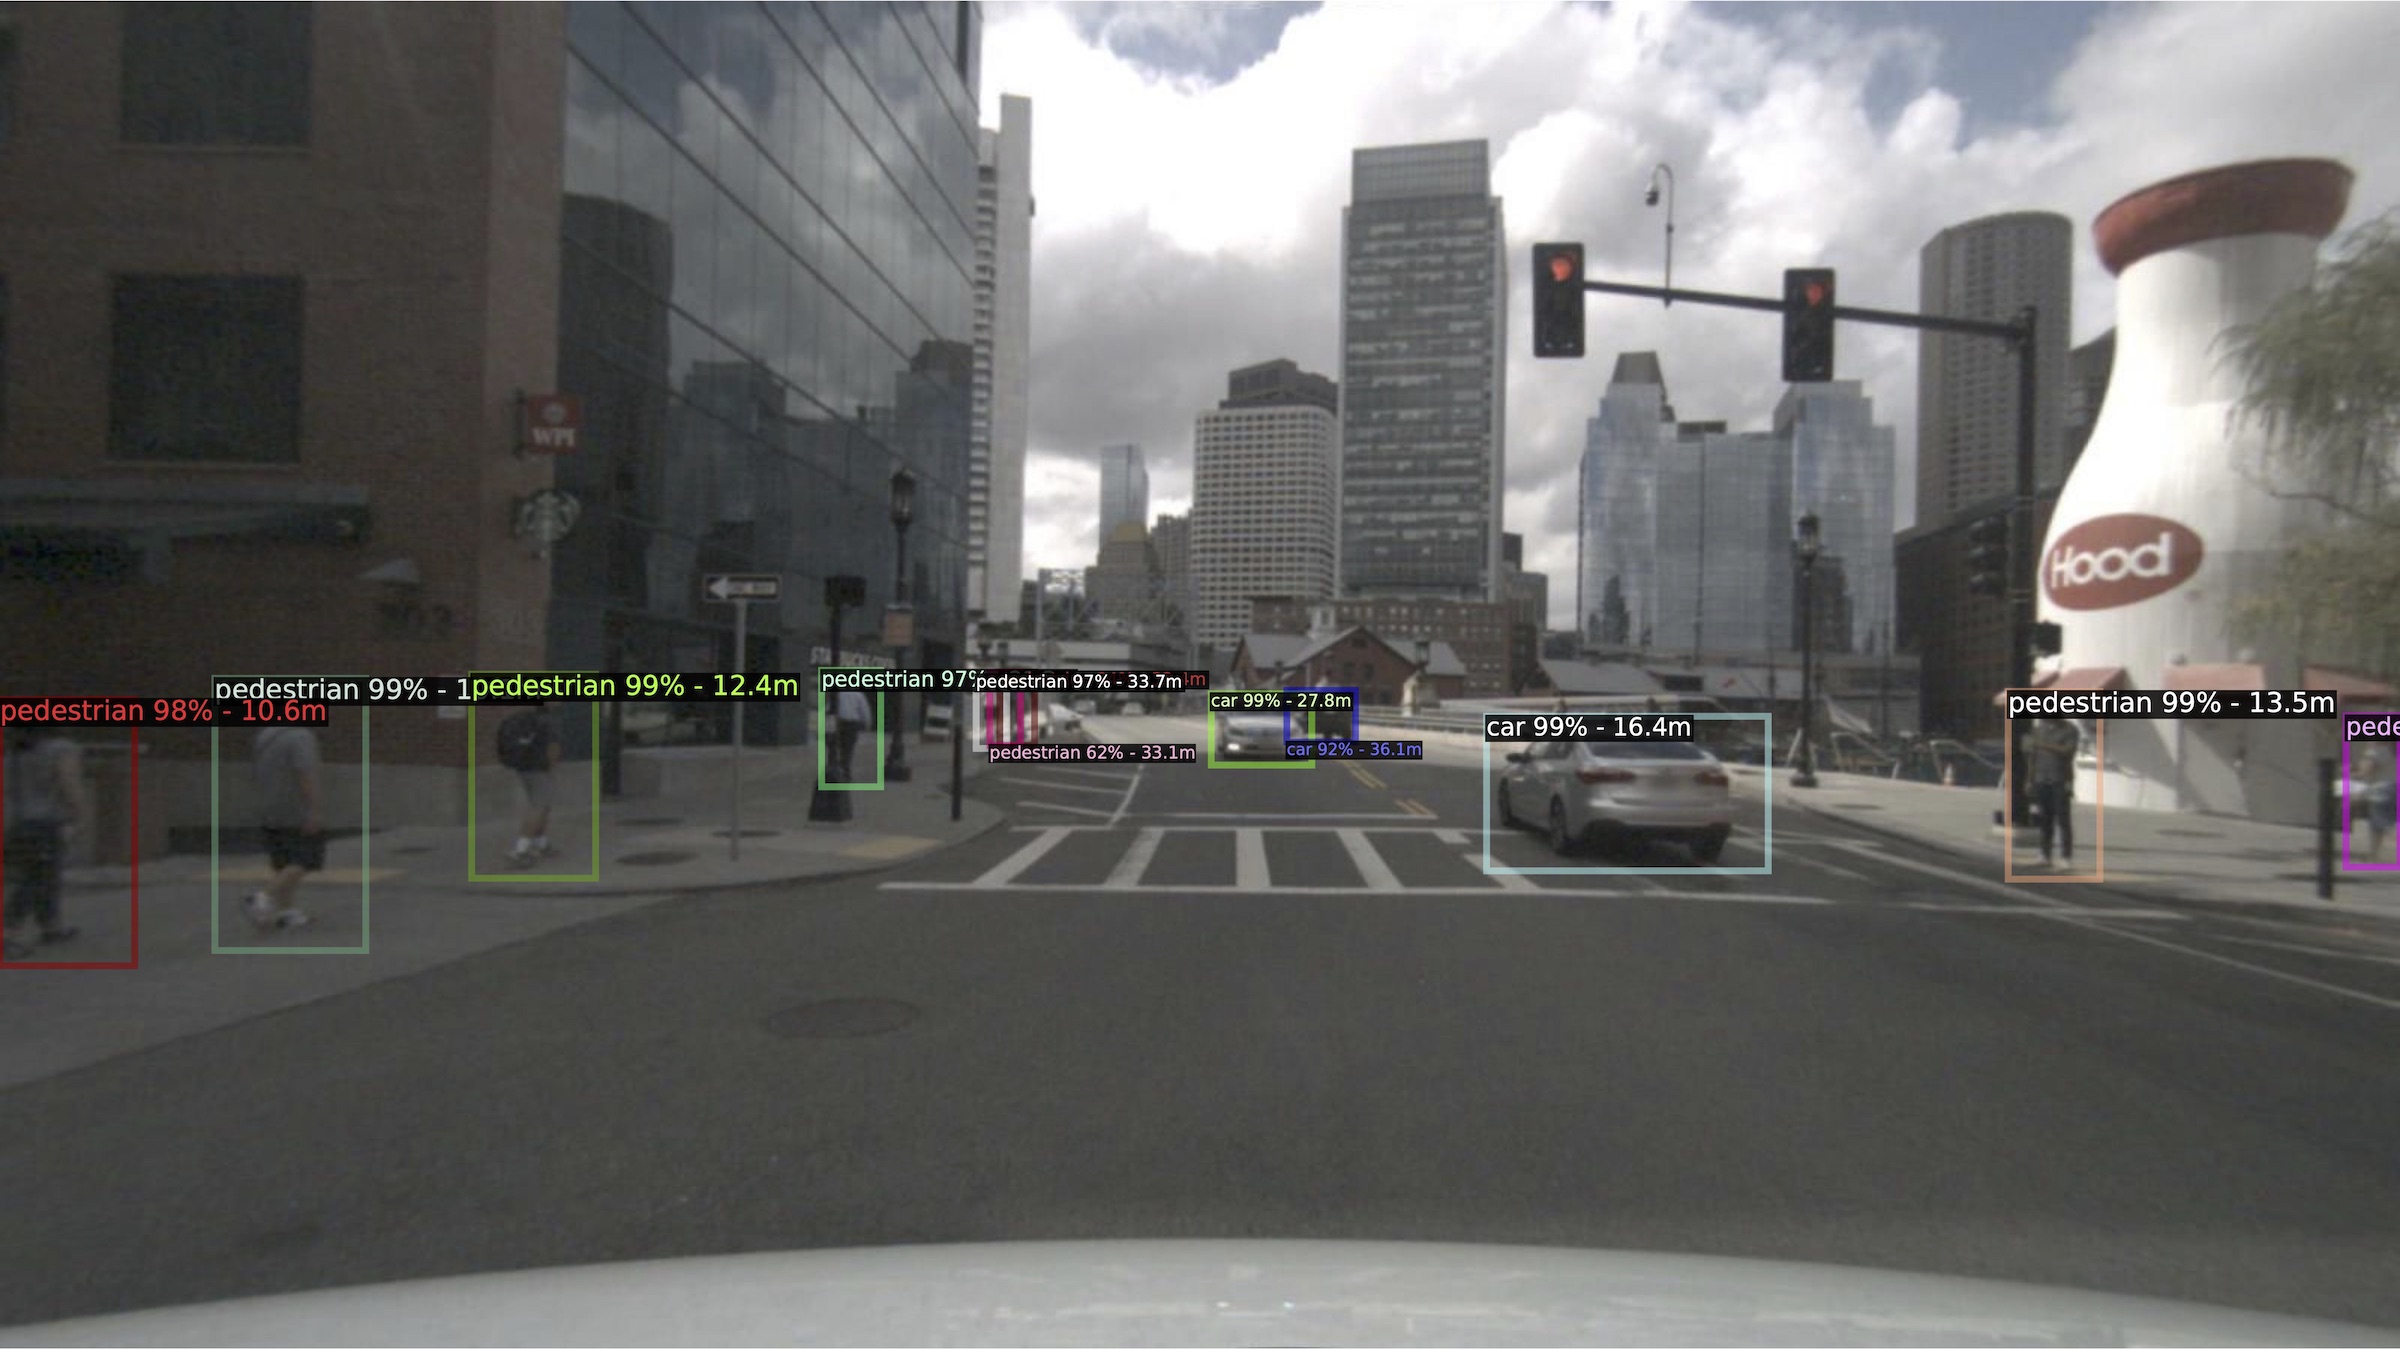
Figures below show the detection results for two different scenes: